
Question- What is the average population growth in between 1876 and 1977?
answer- the average population growth per year in 1876- 1977 is 1975500 People Per Year. (PPY)
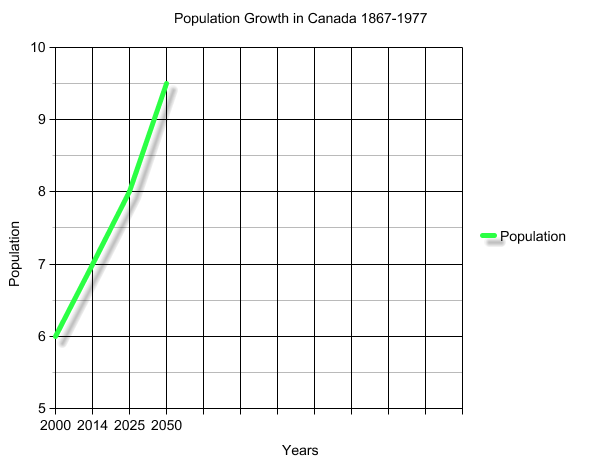
This graph is showing the population growth in Canada in between 1867 and 1977. You may notice that the line’s slope changes every ten years. We did not make it change every year because the program did not have the space to put down 110 different years.
1977 23,258000
slope=288000/y
1967 20,378000
slope=376800/y
1957 16,610000
slope=405900/y
1947 12,551000
slope=150600/y
1937 11,045000
slope=140800/y
1927 9,637000
slope=157700/y
1917 8,060000
slope=164900/y
1907 6,411000
slope=128900/y
1897 5,122000
slope=49600/y
1887 4,626000
slope=56200/y
1877 4,064000
slope=60100/y
1867 3,463000